UK Temperature Tracker (CET)
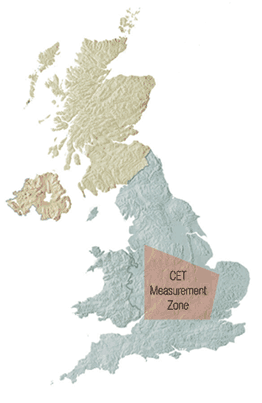
CET has been considered the most effective way of measuring how the UK's temperature averages across long timescales. The area that weather stations are situated within for this measurement cover as far north as Lancashire, then down southwest toward Bristol and across to London - as shown on our CET map.The official CET figure is monitored and recorded by the UK Met Office, the Net-weather Uk temperature tracker, whilst not using the official data, is using a series of weather stations from a very similar area so should provide a good guide every month. The figure will update every hour.
The current N-W UK tracker figure for February 2024 is:
9.29°C
Difference from average February CET is5.1°C
| Month | '71-'00 average | N-W tracker |
|---|---|---|
| January | 4.2C | 5.24°C |
| February | 4.2C | 9.29°C |
| March | 6.3C | 7.28°C |
| April | 8.1C | 8.87°C |
| May | 11.3C | 12.86°C |
| June | 14.1C | 17.45°C |
| July | 16.5C | 16.57°C |
| August | 16.2C | 16.76°C |
| September | 13.7C | 17.28°C |
| October | 10.4C | 12.64°C |
| November | 6.9C | 7.76°C |
| December | 5.1C | 7.72°C |


